COLUMBUS, Ohio (WCMH) — NOAA’s Climate Prediction Center is forecasting a continuation of above-normal temperatures through the beginning of winter (November-January) across much of the country.
The forecast for precipitation leans toward wetter-than-normal conditions in the Pacific Northwest and Great Lakes, with “equal chances” or near-normal precipitation in the Ohio Valley. Drier conditions are expected across the Southern states.
The expectation for generally warmer-than-normal weather is linked to a developing Pacific climate pattern. The Climate Prediction Center is giving a 60% chance of La Niña emerging this month and lingering through March 2025.
La Niña reflects a cyclical cooling of the eastern and central tropical Pacific, the opposite of El Niño, a warm water anomaly that prevailed during the winter of 2023-24.
Average first snowfall in central Ohio
The current mild autumn pattern will delay the appearance of winter in central Ohio until after Nov. 20, when there are signs of a southward shift in the jet stream that will allow cold air to plunge into the eastern part of the country.
We normally see the first snowflakes of the season around Nov. 7 in recent years. (This does not count the graupel, or soft hail, that mixed with rain and hail showers on Oct. 15.)
Last year, the first frightful flurries flew on Halloween. Two years ago, the first snowflakes fell on Oct. 18. In 2021, flurries did not arrive until Nov. 13 and left a coating (0.4 inch) the following morning.
The earliest snowflakes in recent decades were observed on Oct. 4, 2014, while the latest date for the season’s first snowflakes was Dec. 16, 1998, when 0.6 inch dusted the city.
The first accumulation of snow typically occurs around Thanksgiving — Nov. 28, in the past decade — and the average first 1 inch (or more) usually comes around Dec. 7. In the warm winter of 2015-16, the first inch of snow did not arrive until Jan. 10, 2016.
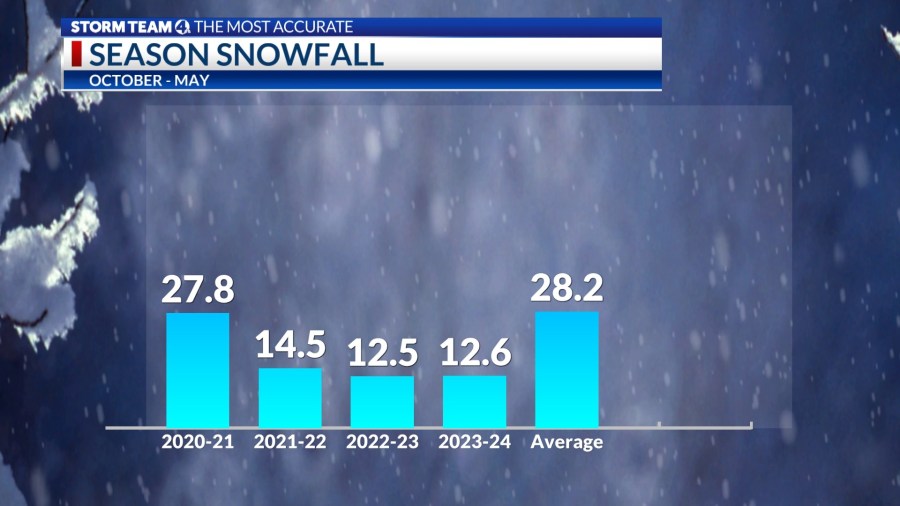
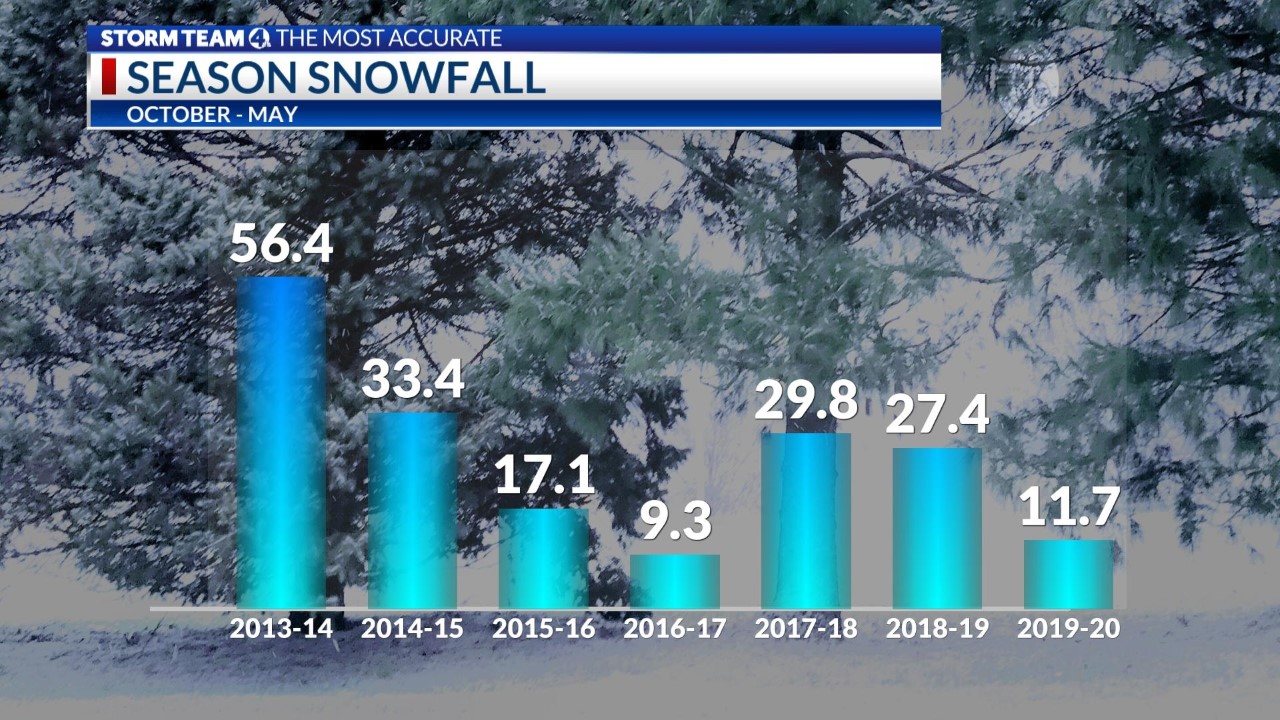
Seasonal snowfall
Measurable snow (0.1 inch or greater) is reported on an average of 28 days, based on the the past 30 years (1991-2020), at John Glenn Columbus International Airport. A typical Columbus winter brings a mean season snowfall of 28.2 inches, with January (9.5 inches) and February (7.6 inches) generally the snowiest months.
The past two winters (2022-23 and 2023-24) have been quite mild, averaging at least 5.5 degrees above normal, with much-below-normal snowfall. The last winter that we even reached our average value was in 2020-21, when below-normal winter temperatures prevailed.
In recent years, the total snowfall in Columbus ranged from 9.3 inches in 2016-17 to a sizable 56.4 inches in the harsh winter of 2013-14.
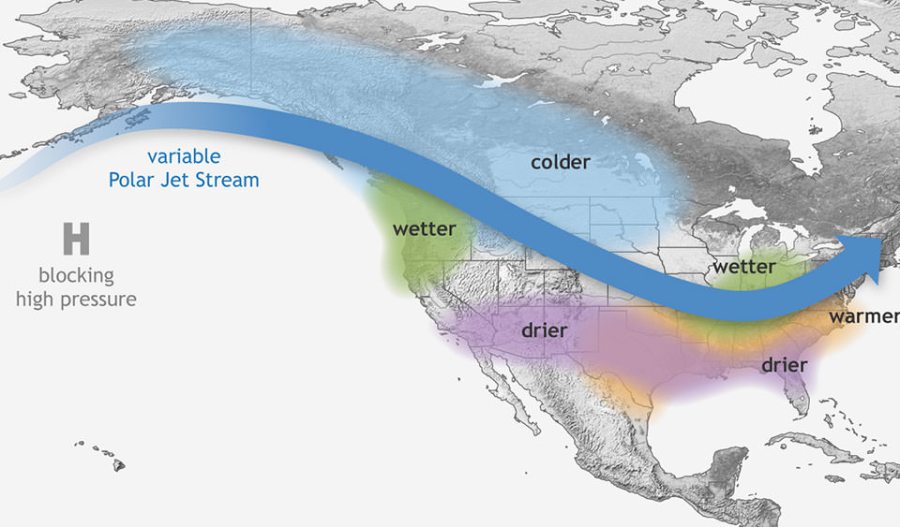
How La Niña usually affects the weather Across the lower 48 states
The search for signs of what to expect this winter often focuses on any evident Pacific climate pattern, one of several factors that influence the average storm track across the continental U.S. in the winter.
Other unpredictable variables at this time are Atlantic air pressure patterns, early snow cover in Eurasia and northern Canada, where cold air builds up, sea surface temperatures in the northern Pacific, and even solar (sunspot) activity.
La Niña is a climate pattern that requires at least three consecutive months of sea surface temperatures averaging at least 0.9 degrees Fahrenheit below normal, according to NOAA.
The influence of La Niña is reflected in the overall jet stream pattern, which controls the storm track and movement of large air masses. The usual northward shift in the jet stream across the continental U.S. shifts the better chance for above-normal precipitation and snowfall to the northern tier of states.
Temperatures tend to run above normal across the southern half of the country, and northward along the Eastern Seaboard and upper Ohio Valley.
Colder air is displaced north of the jet stream, with fewer intrusions of arctic air. These areas will likely experience more snowfall than normal, including the northern Rockies, Upper Midwest, northern Great Lakes and northern New England.
This winter, La Niña is expected to be on the weaker side. One way to gauge probable temperature and precipitation patterns is to look at seasons when La Niña was not classified as “moderate” or “strong” based on seawater temperature anomalies.
Here is a comparison of snowfall and temperatures for December through February since 2000, compared to the average Columbus snowfall (28.2 inches) and temperature (32.2 degrees).
Weak La Niña winters and Columbus winters
| WINTER | SNOWFALL (Oct.-May) | AVERAGE TEMPERATURE (Dec.-Feb.) |
| 2000-01 | 26.3 | 29.1 |
| 2005-06 | 12.9 | 34.7 |
| 2008-09 | 23.2 | 29.9 |
| 2016-17 | 17.1 | 31.6 |
| 2017-18 | 29.8 | 32.4 |
| 2022-23 | 12.5 | 37.7 |
Five of the six winters in La Niña conditions were light on snowfall, versus the 30-year average (1991-2020), while temperatures were above-normal in half of those winters. Yet, several Januarys featured below-normal temperatures, indicating an eventual southward shift of the jet stream for a short period of time in midwinter resulting in plowable snowfalls.
Interestingly, looking at six moderate La Niña seasons since 1950, reflecting a greater sea surface temperature cooling, half of the winters were actually colder than normal with above-average snowfall. In fact, one of the snowiest winters on record in 1995-96 (54.1 inches) occurred during La Niña.
All of this points to the complexity in atmospheric responses to the influence of Pacific climate patterns. A weaker Pacific anomaly this year suggests other variables, including Atlantic atmospheric pressure and the position of strength of the polar vortex in northern Canada, could come into play later in the season.