Columbus (WCMH) – Columbus weather records go back to 1878 and we have had 34 Presidential elections since that time. Tuesday will be the 35th, and I tried to use Mother Nature to give us a hint to the winner tomorrow.Let me be clear, this is NOT an endorsement of a candidate, more of a fun look at trends:
In doing this, I looked at the data from each Presidential Election year, and looked at the weather that we had here in Ohio (in Columbus).Since 1880 some weather stats have stood out:
- We have been as warm as 74° (1964) on Election Day
- We have been as chilly as 40° (1892) for an Election Day high
- We have been as wet as 1.16″ on Election Day
- Exactly 50% of our election days have been dry
Lets look at the high temps first, and how they have impacted the outcome on Election Day:
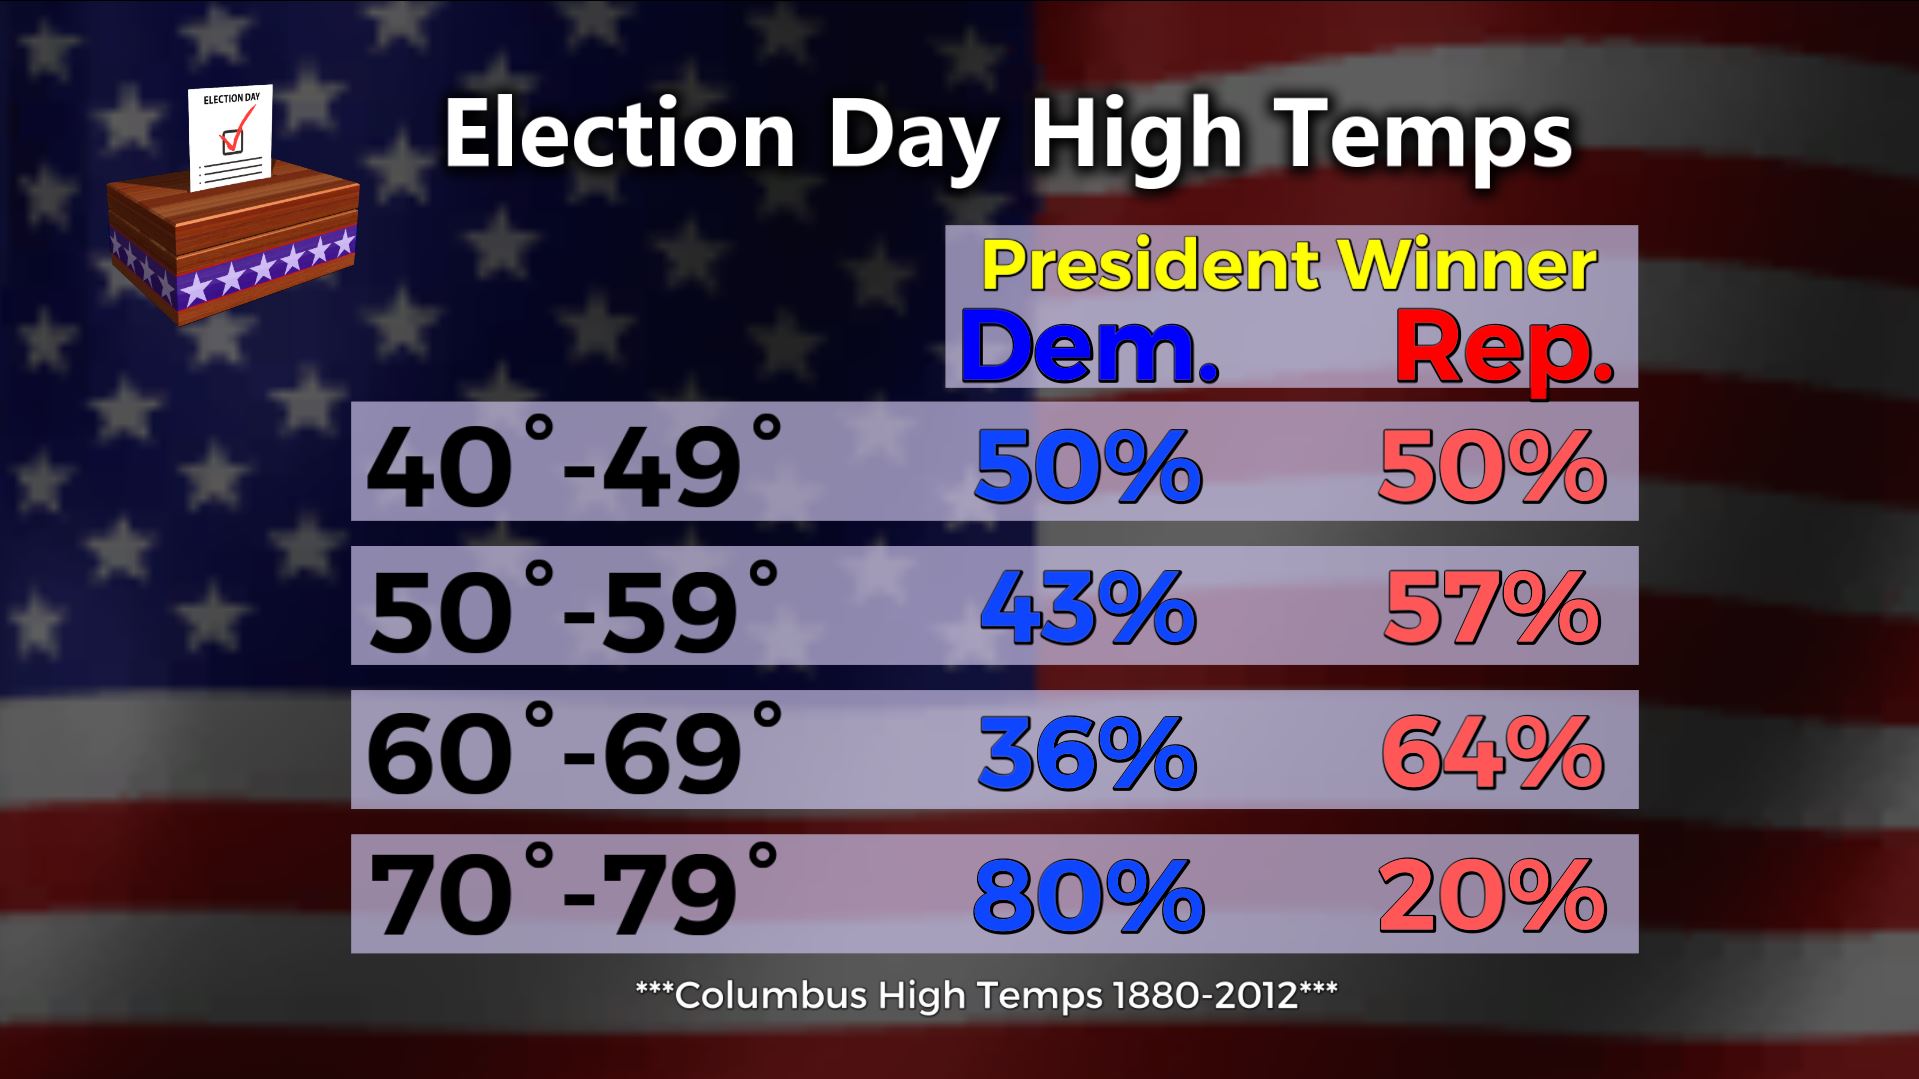
From this graphic, it appears when we have a cool day with highs in the 40s, its a toss up. When highs are somewhat around normal (50°-69°), the Republican candidate wins 60% of the time. But when temps are more than a dozen above normal in the 70s, the Democratic candidates mainly win.Next, we look at how rainfall, or lack of it can impact the outcome on Election Day:
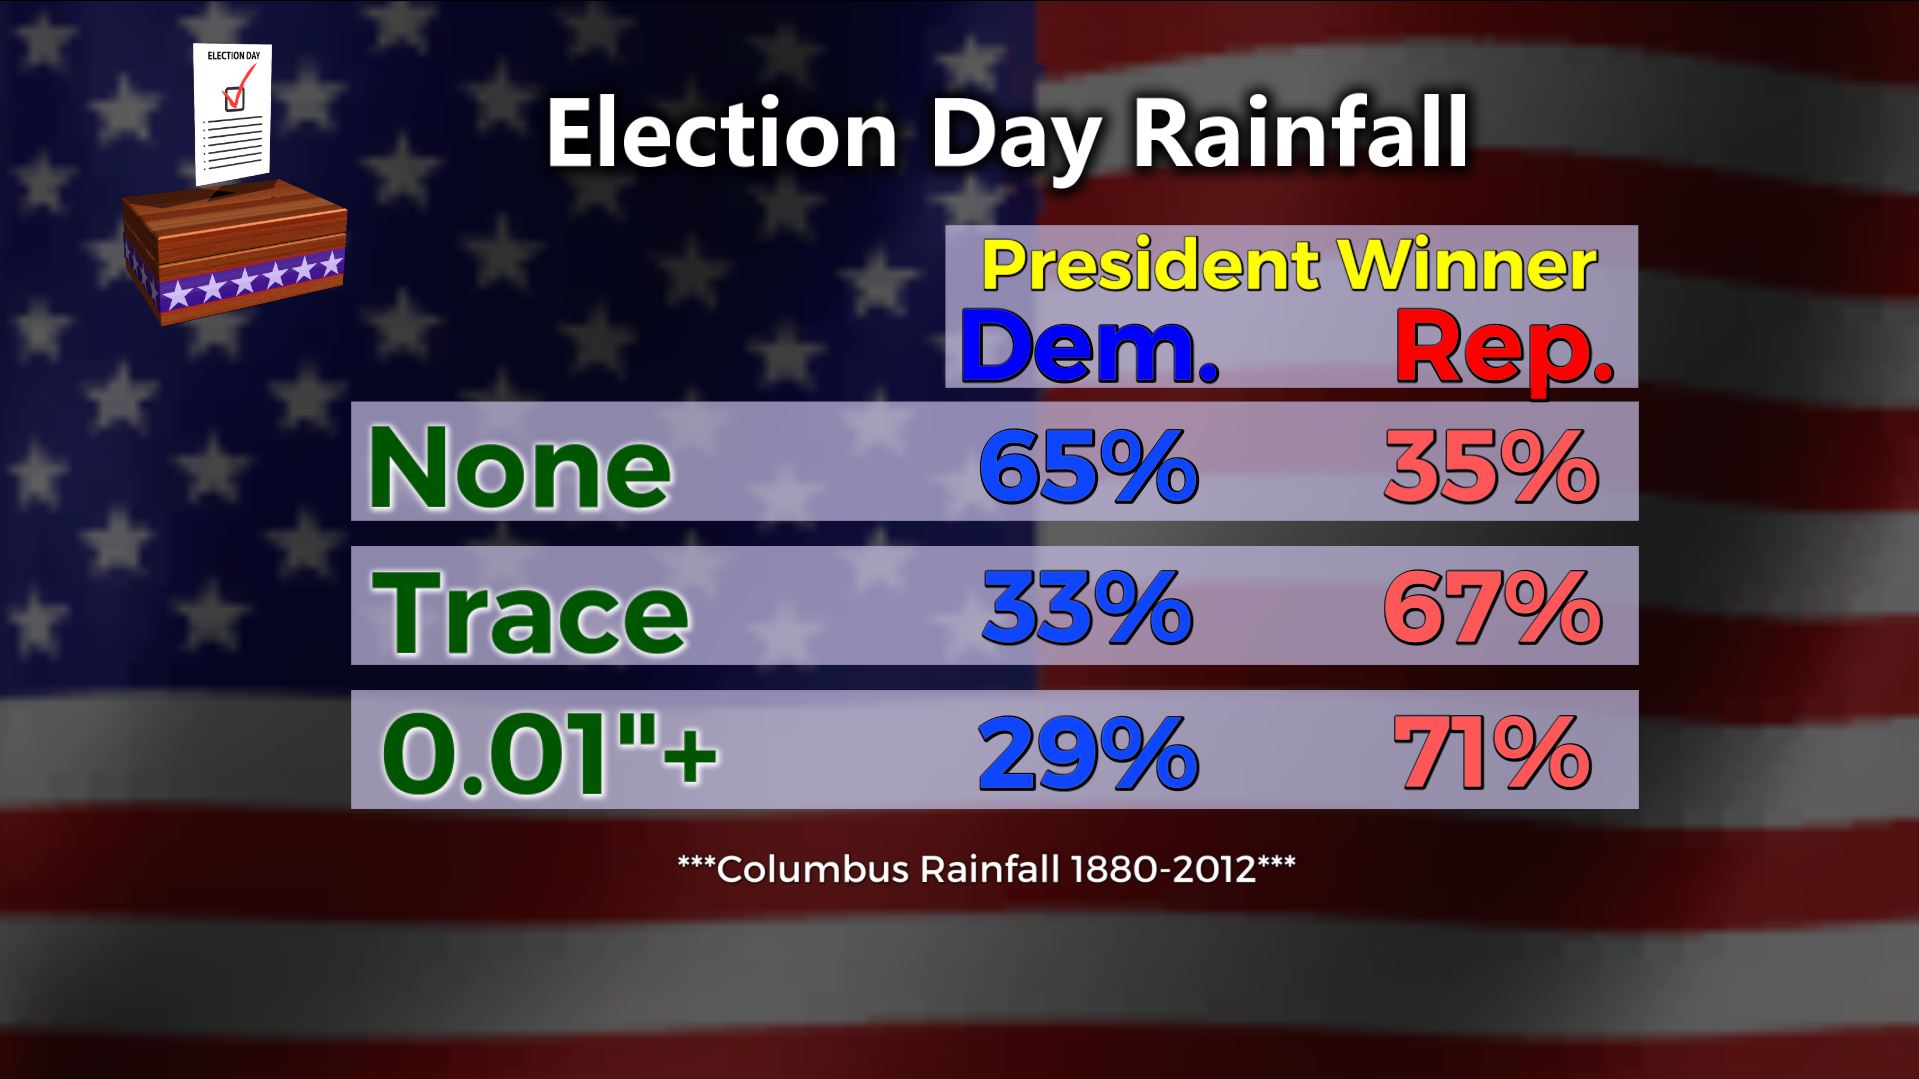
From this graphic, when it is dry in Columbus, the Democratic candidate does better in the General Election, winning 65% of the time. Interestingly, if we get some light sprinkles, 67% of the time (2/3 times) the Republican candidate won. And when it rains, the votes appear to pour in for the Republican candidate. In fact, on the rainiest day on Columbus Election Day history, the Republican won. Also, the top 4 rainiest days in Columbus on Election Day, all saw the Republican candidate win nationally.Finally, I looked at days that were similar to 2016, with temps in the mid 60s, and tried to narrow the chance of rain too (if possible):
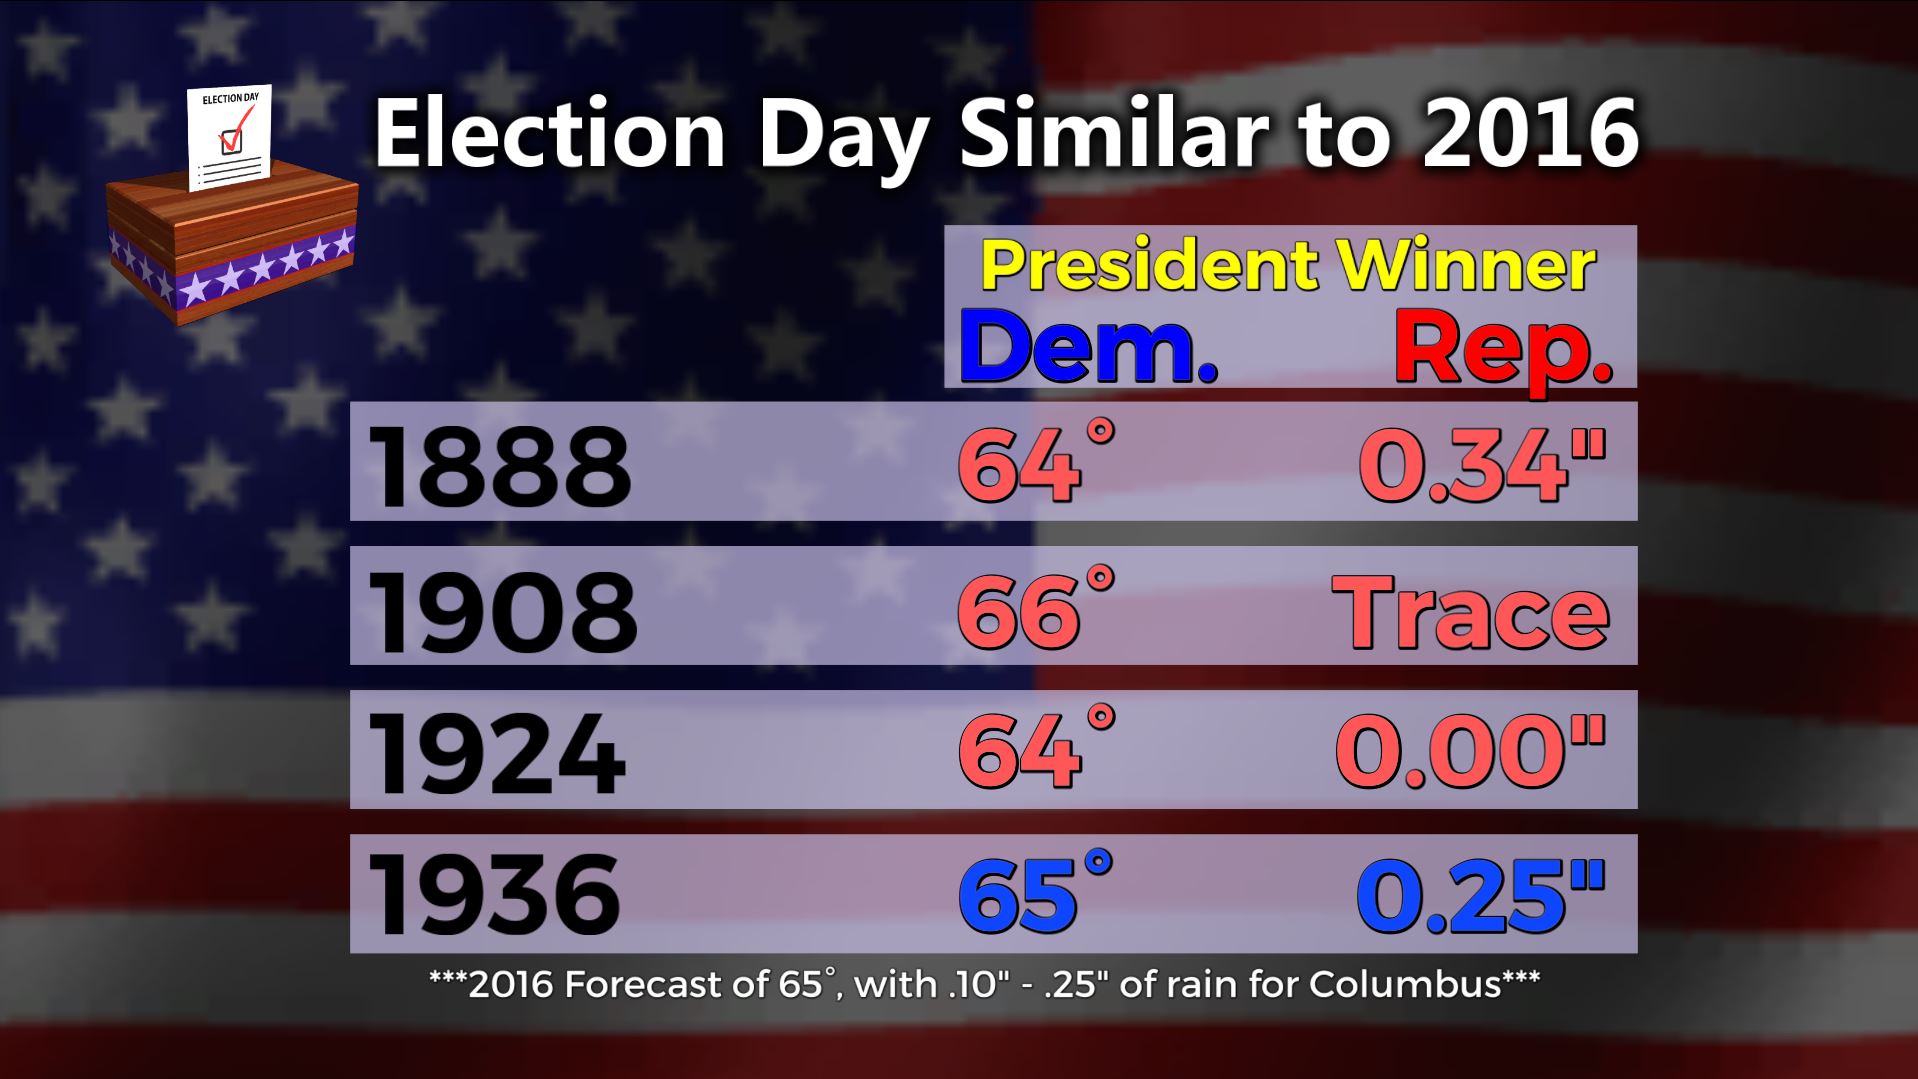
As you can see, when its in the mid-60’s for highs, the Republican has won 75% of the time. However, the forecast for Tuesday is a high of 65° and about 0.10″-0.25″ of rainfall, and in 1936 we had almost the same weather, and the Democrat won that year. Again, I really doubt that if the temp is a degree warmer/cooler, or if it is slighty wetter or drier it will change the outcome in either direction. This is just for fun!Bottom line, this is who wins:
Mother nature of course!!! She always does 🙂 Since 1880 election, we have not had snow on election day, and the weather in general has been fairly tame for Central Ohio standards. Ultimately, it is up to all of us voters to determine who wins tomorrow, so go out and vote!Here is the final data for the 34 previous Presidential Elections that we have good weather data for here in Columbus:
| Ohio Vote | High Temp | Weather | |
| 2 November 1880 | R | 59° | Dry |
| 4 November 1884 | R | 56° | 0.11″ |
| 6 November 1888 | R | 64° | 0.34″ |
| 8 November 1892 | R | 40° | Dry |
| 3 November 1896 | R | 71° | Dry |
| 6 November 1900 | R | 56° | Trace |
| 8 November 1904 | R | 55° | 0.07″ |
| 3 November 1908 | R | 66° | Trace |
| 5 November 1912 | D | 58° | Dry |
| 7 November 1916 | D | 72° | Dry |
| 2 November 1920 | R | 58° | 0.34″ |
| 4 November 1924 | R | 64° | Dry |
| 6 November 1928 | R | 58° | Dry |
| 8 November 1932 | D | 70° | Dry |
| 3 November 1936 | D | 65° | 0.25″ |
| 5 November 1940 | D | 60° | 0.24″ |
| 7 November 1944 | R | 54° | Dry |
| 2 November 1948 | D | 68° | Dry |
| 4 November 1952 | R | 46° | Dry |
| 6 November 1956 | R | 68° | 0.02″ |
| 8 November 1960 | R | 53° | 0.05″ |
| 3 November 1964 | D | 74° | Dry |
| 5 November 1968 | R | 62° | Dry |
| 7 November 1972 | R | 53° | 1.16″ |
| 2 November 1976 | D | 54° | Dry |
| 4 November 1980 | R | 59° | 0.07″ |
| 6 November 1984 | R | 46° | 0.02″ |
| 8 November 1988 | R | 51° | 0.16″ |
| 3 November 1992 | D | 69° | Dry |
| 5 November 1996 | D | 56° | Trace |
| 7 November 2000 | R | 67° | 0.15″ |
| 2 November 2004 | R | 68° | 0.52″ |
| 4 November 2008 | D | 72° | Dry |
| 6 November 2012 | D | 49° | Dry |
If you have any questions about Election Day weather, or any other type of weather, send them my way at dmazza@wcmh.com
-Dave