Columbus (WCMH) – Officially at 12:24am this morning we marched into Summer. Spring 2017 turned out to be warmer and wetter than normal, but not by a lot.Features of Spring 2017:
- Average high temperature: 73.2°
- Average low temperature: 52.1°
- Average combined temperature: 62.6°
- Difference from normal: +3.7°
- April was the warmest (#1) April on record, +6.6°
- May was the 54th warmest May on record, +0.5°
- Warmest temp was 93° (June 12th, June 16th)
- Spring 2017 received 12.74″ of rain, +1.25″ above normal
- Spring had 11 days with a trace of rain
- Spring had 39 days with measurable (0.01″ or greater) rain
- Spring had 2 days with snow flurries
- Spring had no measurable snowfall
Temperature Frequency in Spring (93 days, March 20-June 20):
| Highs | Lows | |
| 90s | 5 | 0 |
| 80s | 26 | 0 |
| 70s | 27 | 4 |
| 60s | 24 | 16 |
| 50s | 8 | 40 |
| 40s | 3 | 21 |
| 30s | 0 | 10 |
| 20s | 0 | 2 |
Precipitation Frequency in Spring (93 days, March 20-June 20):
| Rain | Snow | |
| Trace | 11 | 2 |
| .01-.1″ | 15 | 0 |
| .11-.25″ | 7 | 0 |
| .25-.50″ | 6 | 0 |
| .50-.99″ | 9 | 0 |
| 1″+ | 2 | 0 |
| sum | 50 | 2 |
| % | 54% | 2% |
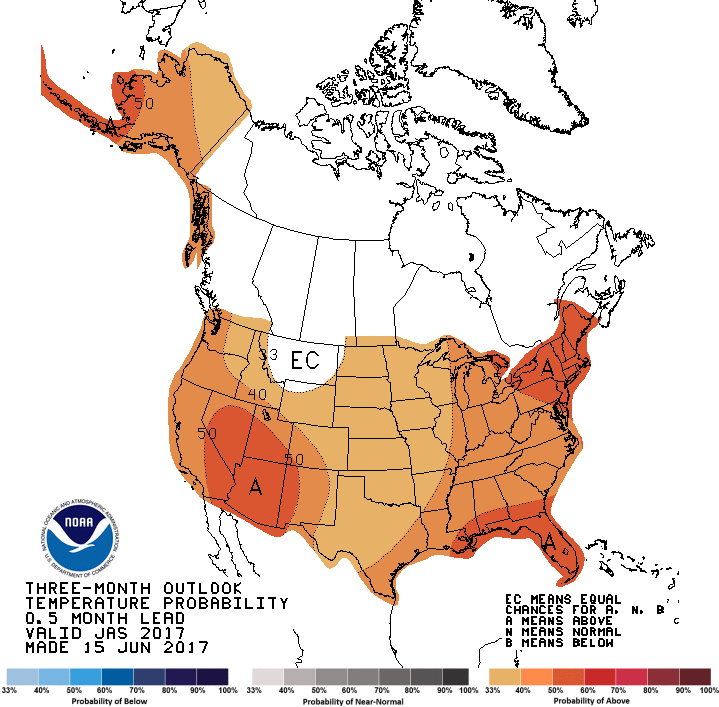
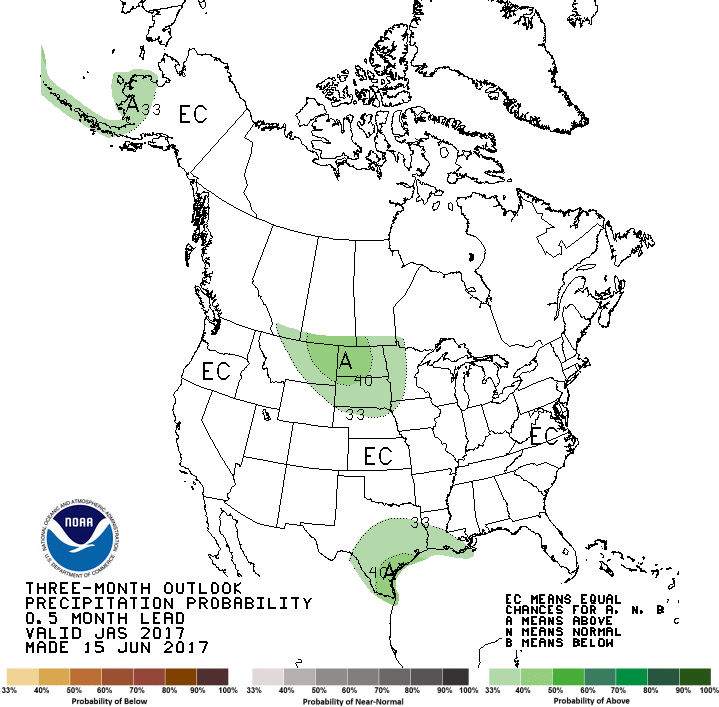
Below is the 3 month outlook from the Climate Prediction Center at NOAA:
This outlook covers Mid-June to Mid-September, or the majority of Summer 2017.
First is the outlook for temperatures, which shows a better chance of above normal temperatures for almost then entire US, including Alaska.
Below that is the forecast for precipitation, which shows near normal precipitation for most except in the mid-section of the country.


Below is the full data for highs, lows, departure from normal, rainfall, and snowfall for Spring 2017 in Columbus:
| high | low | average | dep(+/-) | precip. | snow | |
| 3/20/2017 | 47 | 31 | 39 | -4.3 | 0.3 | |
| 3/21/2017 | 59 | 37 | 48 | 4.3 | ||
| 3/22/2017 | 42 | 27 | 34.5 | -9.6 | ||
| 3/23/2017 | 56 | 24 | 40 | -4.5 | ||
| 3/24/2017 | 76 | 49 | 62.5 | 17.7 | T | |
| 3/25/2017 | 75 | 58 | 66.5 | 21.3 | ||
| 3/26/2017 | 65 | 53 | 59 | 13.4 | 1.53 | |
| 3/27/2017 | 68 | 50 | 59 | 13 | 0.03 | |
| 3/28/2017 | 61 | 45 | 53 | 6.6 | 0.03 | |
| 3/29/2017 | 64 | 40 | 52 | 5.3 | ||
| 3/30/2017 | 77 | 49 | 63 | 15.9 | 0.3 | |
| 3/31/2017 | 60 | 44 | 52 | 4.5 | 0.78 | |
| 4/1/2017 | 49 | 39 | 44 | -3.9 | ||
| 4/2/2017 | 63 | 35 | 49 | 0.7 | ||
| 4/3/2017 | 69 | 48 | 58.5 | 9.9 | 0.13 | |
| 4/4/2017 | 64 | 47 | 55.5 | 6.5 | T | |
| 4/5/2017 | 74 | 40 | 57 | 7.6 | 0.67 | |
| 4/6/2017 | 60 | 36 | 48 | -1.7 | 0.11 | T |
| 4/7/2017 | 52 | 35 | 43.5 | -6.6 | 0.02 | T |
| 4/8/2017 | 61 | 32 | 46.5 | -4 | ||
| 4/9/2017 | 76 | 40 | 58 | 7.1 | ||
| 4/10/2017 | 80 | 59 | 69.5 | 18.3 | ||
| 4/11/2017 | 65 | 54 | 59.5 | 7.9 | 0.45 | |
| 4/12/2017 | 67 | 44 | 55.5 | 3.6 | ||
| 4/13/2017 | 69 | 47 | 58 | 5.7 | T | |
| 4/14/2017 | 76 | 53 | 64.5 | 11.9 | T | |
| 4/15/2017 | 81 | 55 | 68 | 15 | 0.01 | |
| 4/16/2017 | 80 | 63 | 71.5 | 18.2 | 0.01 | |
| 4/17/2017 | 70 | 54 | 62 | 8.3 | T | |
| 4/18/2017 | 76 | 49 | 62.5 | 8.5 | 0.01 | |
| 4/19/2017 | 78 | 63 | 70.5 | 16.1 | T | |
| 4/20/2017 | 84 | 61 | 72.5 | 17.8 | 0.05 | |
| 4/21/2017 | 68 | 50 | 59 | 4 | 0.01 | |
| 4/22/2017 | 57 | 42 | 49.5 | -5.8 | 0.07 | |
| 4/23/2017 | 71 | 37 | 54 | -1.7 | ||
| 4/24/2017 | 72 | 44 | 58 | 2 | ||
| 4/25/2017 | 76 | 54 | 65 | 8.7 | ||
| 4/26/2017 | 85 | 56 | 70.5 | 13.9 | ||
| 4/27/2017 | 76 | 53 | 64.5 | 7.6 | T | |
| 4/28/2017 | 72 | 46 | 59 | 1.8 | 0.25 | |
| 4/29/2017 | 76 | 56 | 66 | 8.5 | 0.8 | |
| 4/30/2017 | 85 | 56 | 70.5 | 12.7 | T | |
| 5/1/2017 | 76 | 54 | 65 | 6.9 | 0.57 | |
| 5/2/2017 | 63 | 48 | 55.5 | -2.9 | 0.04 | |
| 5/3/2017 | 59 | 45 | 52 | -6.7 | T | |
| 5/4/2017 | 63 | 50 | 56.5 | -2.5 | 0.61 | |
| 5/5/2017 | 57 | 45 | 51 | -8.3 | 0.72 | |
| 5/6/2017 | 59 | 45 | 52 | -7.6 | 0.04 | |
| 5/7/2017 | 60 | 38 | 49 | -10.9 | ||
| 5/8/2017 | 60 | 35 | 47.5 | -12.7 | ||
| 5/9/2017 | 57 | 41 | 49 | -11.5 | T | |
| 5/10/2017 | 74 | 51 | 62.5 | 1.7 | ||
| 5/11/2017 | 67 | 55 | 61 | 0 | 0.17 | |
| 5/12/2017 | 64 | 50 | 57 | -4.3 | ||
| 5/13/2017 | 73 | 45 | 59 | -2.6 | ||
| 5/14/2017 | 82 | 54 | 68 | 6.1 | ||
| 5/15/2017 | 76 | 52 | 64 | 1.8 | ||
| 5/16/2017 | 87 | 58 | 72.5 | 10 | ||
| 5/17/2017 | 88 | 67 | 77.5 | 14.7 | ||
| 5/18/2017 | 85 | 70 | 77.5 | 14.4 | 0.02 | |
| 5/19/2017 | 84 | 56 | 70 | 6.6 | 1.49 | |
| 5/20/2017 | 76 | 54 | 65 | 1.3 | 0.02 | |
| 5/21/2017 | 75 | 65 | 70 | 6 | 0.66 | |
| 5/22/2017 | 68 | 52 | 60 | -4.3 | ||
| 5/23/2017 | 75 | 51 | 63 | -1.6 | ||
| 5/24/2017 | 69 | 60 | 64.5 | -0.4 | 0.02 | |
| 5/25/2017 | 69 | 58 | 63.5 | -1.7 | 0.36 | |
| 5/26/2017 | 76 | 57 | 66.5 | 1 | 0.18 | |
| 5/27/2017 | 81 | 63 | 72 | 6.2 | 0.12 | |
| 5/28/2017 | 79 | 65 | 72 | 5.8 | T | |
| 5/29/2017 | 82 | 61 | 71.5 | 5 | 0.22 | |
| 5/30/2017 | 80 | 58 | 69 | 2.2 | ||
| 5/31/2017 | 80 | 56 | 68 | 0.9 | ||
| 6/1/2017 | 78 | 51 | 64.5 | -2.9 | ||
| 6/2/2017 | 82 | 53 | 67.5 | -0.3 | ||
| 6/3/2017 | 86 | 54 | 70 | 1.9 | ||
| 6/4/2017 | 89 | 65 | 77 | 8.6 | 0.27 | |
| 6/5/2017 | 83 | 59 | 71 | 2.3 | 0.72 | |
| 6/6/2017 | 73 | 54 | 63.5 | -5.5 | ||
| 6/7/2017 | 66 | 56 | 61 | -8.3 | ||
| 6/8/2017 | 76 | 52 | 64 | -5.6 | ||
| 6/9/2017 | 82 | 53 | 67.5 | -2.5 | ||
| 6/10/2017 | 86 | 64 | 75 | 4.7 | ||
| 6/11/2017 | 90 | 67 | 78.5 | 7.9 | ||
| 6/12/2017 | 93 | 66 | 79.5 | 8.7 | ||
| 6/13/2017 | 88 | 74 | 81 | 9.9 | 0.04 | |
| 6/14/2017 | 83 | 69 | 76 | 4.6 | ||
| 6/15/2017 | 86 | 70 | 78 | 6.3 | ||
| 6/16/2017 | 93 | 70 | 81.5 | 9.5 | ||
| 6/17/2017 | 91 | 69 | 80 | 7.8 | ||
| 6/18/2017 | 90 | 69 | 79.5 | 7 | 0.57 | |
| 6/19/2017 | 82 | 59 | 70.5 | -2.2 | 0.34 | |
| 6/20/2017 | 82 | 59 | 70.5 | -2.4 |
If you have any questions about Spring, Summer, climate, or any other weather question, email me: dmazza@wcmh.com
-Dave


